How to Use BLS Salary Data to Find What Your Job Should Pay
Learn how to use BLS Occupational Employment and Wage Statistics to research pay for your occupation, compare national, state, metro, and industry wages, understand percentiles, and use the data as a salary benchmark.
In this article
- What Is BLS Salary Data?
- How to Use BLS Salary Data: The Basic Process
- 1. Identify the closest BLS occupation
- 2. Choose the appropriate geographic level
- 3. Look beyond the median
- What Does the BLS Median Salary Mean?
- Mean vs. Median: Which BLS Number Should You Use?
- Should You Use National, State, or City-Level BLS Data?
- National data
- State data
- Metropolitan and nonmetropolitan data
- Why Industry Can Change the Salary Benchmark
- How to Compare Your Salary With BLS Data
- Does BLS Salary Data Include Bonuses and Benefits?
- Why Your Salary May Be Different From the BLS Median
- Location
- Industry
- Experience
- Education
- Job responsibilities
- Compensation structure
- What BLS Salary Data Does Not Tell You
- How Current Is BLS Salary Data?
- How to Use BLS Data in a Salary Negotiation
- BLS Salary Data vs. Other Salary Sources
- Common Mistakes When Using BLS Salary Data
- Using your job title instead of your actual occupation
- Looking only at the national median
- Treating the 50th percentile as your minimum
- Treating the 75th percentile as the correct salary request
- Assuming percentiles equal experience levels
- Ignoring industry
- Comparing total compensation with an OEWS wage number
- Using an outdated BLS dataset without checking the reference period
- A Simple BLS Salary Research Checklist
- The Best Way to Interpret BLS Salary Data
- Conclusion
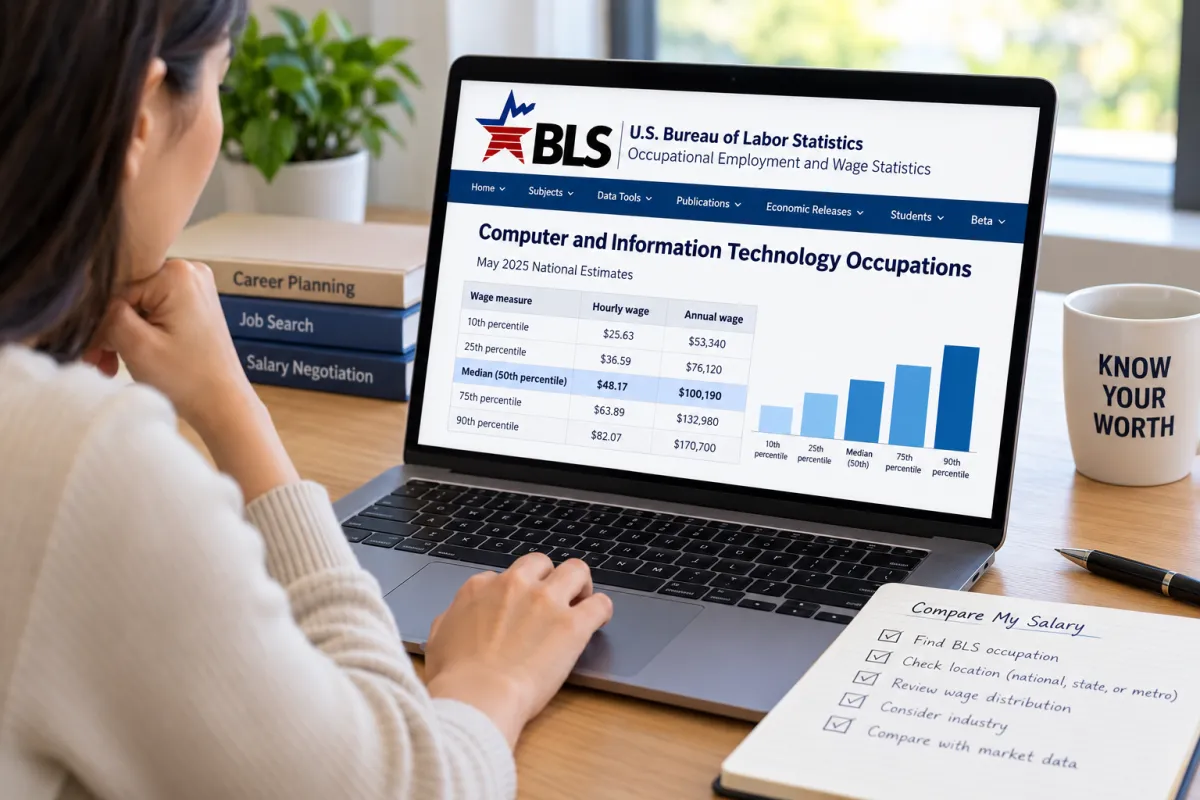
If you want to know whether your salary is competitive, one of the most useful places to start is the U.S. Bureau of Labor Statistics (BLS). Its Occupational Employment and Wage Statistics (OEWS) program provides wage estimates for hundreds of occupations across the United States.
The important part is knowing how to interpret those numbers.
BLS salary data is not a personalized calculator that tells you exactly what your employer should pay you. Instead, it gives you a broader market benchmark. You can use that benchmark to compare your pay with workers in the same or similar occupation, location, and industry, then consider factors such as experience and education.
A practical approach is:
Find the closest occupation → choose the right geographic area → examine the wage distribution → consider the industry → account for your circumstances → compare with other current market evidence.
That approach is much more useful than simply searching for one salary number and assuming it represents what your job should pay.
What Is BLS Salary Data?
BLS salary data generally refers to wage information published through the Bureau of Labor Statistics' Occupational Employment and Wage Statistics program, or OEWS.
OEWS provides employment and wage estimates for approximately 830 occupational categories. The program publishes information at several geographic levels, including national, state, metropolitan and nonmetropolitan areas. BLS also provides national industry-specific estimates.
For many occupations, the data includes:
-
Mean hourly wage
-
Mean annual wage
-
10th percentile wage
-
25th percentile wage
-
50th percentile wage, or median
-
75th percentile wage
-
90th percentile wage
This makes the data more useful than a single "average salary" because you can see how wages are distributed across the occupation.
The current OEWS dataset approved for this article is May 2025, which BLS released on May 15, 2026.
You can access the official data through the BLS OEWS tables and occupation profiles.
How to Use BLS Salary Data: The Basic Process
Using BLS salary data effectively does not require complicated calculations. The challenge is choosing the right data and interpreting it correctly.
Here is a practical process you can follow.
1. Identify the closest BLS occupation
Start with the work you actually perform rather than relying only on your job title.
Your employer might call you a "Marketing Specialist," "Operations Coordinator," "Business Analyst," or something else. BLS uses standardized occupational classifications, and the closest BLS occupation may not have exactly the same title as your position.
Look at the occupation's description and typical duties. The goal is to find the BLS category that best represents the work you do.
This step matters because comparing your salary with the wrong occupation can produce a misleading result.
For example, two employees might both have "Manager" in their titles but work in very different occupations. Their responsibilities, industries, and labor markets could be substantially different.
2. Choose the appropriate geographic level
Next, decide whether you should use national, state, or metropolitan wage data.
BLS provides national estimates as well as state and metropolitan/nonmetropolitan estimates. There are approximately 530 metropolitan and nonmetropolitan areas represented in the OEWS geographic data.
If you work in a specific metropolitan area and an appropriate estimate is available for your occupation, that information can provide useful local context.
State data can provide a broader benchmark when a metro-area estimate is unavailable or when you want to understand how your pay compares within your state.
National data is useful when you want a broad picture of the occupation across the United States.
A useful strategy is not necessarily to choose only one. You can compare the national figure with the state or metro figure to understand how geography affects the market.
3. Look beyond the median
Finding the 50th percentile is only the beginning.
BLS wage distributions allow you to see several points across the occupation's reported wage range. The 10th, 25th, 50th, 75th, and 90th percentiles show where wage values fall within the distribution.
For example, conceptually:
| BLS measure | What it tells you |
|---|---|
| 10th percentile | A lower point in the reported wage distribution |
| 25th percentile | A wage point below the median |
| 50th percentile | The median wage |
| 75th percentile | A wage point above the median |
| 90th percentile | A higher point in the reported wage distribution |
These figures are distribution points, not official labels for junior, mid-level, senior, or expert workers.
That distinction is important.
It would be incorrect to assume that the 25th percentile automatically represents an entry-level salary or that the 75th percentile automatically represents what a highly experienced employee should earn.
Experience and education can influence where an individual falls within the wage distribution, but BLS does not turn these percentile figures into individualized career-level recommendations.
What Does the BLS Median Salary Mean?
The 50th percentile is the median wage.
In a wage distribution, the median is the point at which half of the reported wages are below the value and half are above it.
That makes the median a useful reference point when researching your market.
But it should not automatically be treated as:
-
The minimum salary you should accept
-
Your personal "fair salary"
-
The salary your employer is required to pay
-
A guaranteed salary for your experience level
-
The correct number to request in a negotiation
Suppose the BLS median for an occupation in a particular area is higher than your current salary. That can be a reason to investigate further, but it does not by itself prove that you are underpaid.
You still need to consider whether the occupation classification is correct, whether the geographic data is appropriate, what industry you work in, and how your experience and education compare with the broader workforce.
The median is best understood as a market reference point, not a personal salary verdict.
Mean vs. Median: Which BLS Number Should You Use?
BLS provides both mean wages and percentile information.
The mean is the arithmetic average of the reported wages. The median is the 50th percentile.
These can tell you different things about the wage distribution.
A mean can be influenced by higher or lower wage values in the distribution. The median provides the midpoint of the distribution.
For salary research, it is useful to look at both rather than automatically choosing whichever number is higher.
More importantly, do not stop at a single number. The surrounding percentiles can help you understand the broader wage distribution.
If the mean and median differ substantially, that is another reason to examine the wage distribution instead of treating one number as the definitive market salary.
Should You Use National, State, or City-Level BLS Data?
The best geographic data depends on what you are trying to learn.
National data
National estimates are useful when you want a broad benchmark for an occupation across the United States.
They can be particularly helpful if you are:
-
Comparing opportunities in different states
-
Researching a career before choosing a location
-
Looking for a general occupation benchmark
-
Working in a role where geographic comparison is important
However, national data may hide significant differences between local labor markets.
State data
State estimates can provide a more location-specific benchmark.
They can be useful when your question is something like:
"How does this occupation generally pay in my state?"
State data is broader than metro-level data, so it should not automatically be treated as the exact market rate in your city.
Metropolitan and nonmetropolitan data
If you are researching pay for a particular local labor market, metropolitan data can provide additional context when the relevant occupation is available.
This can be especially useful when the national or state figure seems too broad for your situation.
BLS publishes metropolitan and nonmetropolitan OEWS estimates separately.
The key is to use the most relevant available geographic level rather than choosing a location simply because it produces a more favorable salary number.
Why Industry Can Change the Salary Benchmark
Your occupation is only one part of the salary picture.
BLS also publishes national industry-specific OEWS estimates.
This matters because the same occupation can exist in very different industries.
For example, an analyst, engineer, designer, or manager may perform broadly similar occupational work while working in different industries with different labor markets.
If industry-specific data is available and relevant to your situation, compare it with the broader occupational benchmark.
This can help answer a more useful question:
"How does compensation for this occupation look in the industry where I actually work?"
rather than simply:
"What does everyone in this occupation earn?"
Industry data should still be treated as a benchmark rather than a personalized salary recommendation.
How to Compare Your Salary With BLS Data
Once you have identified the occupation, location, and relevant wage information, you can make a structured comparison.
Start with these questions:
-
Did I choose the correct occupation?
-
Am I using the right geographic area?
-
Is industry-specific data relevant to my situation?
-
Where does my current wage fall relative to the BLS distribution?
-
How do my experience and education compare with the broader workforce?
-
Are there current job-market sources that provide additional evidence?
Imagine that your current annual pay is below the median reported for your occupation in your metropolitan area.
That is useful information, but it is not the end of the analysis.
You should investigate whether:
-
Your duties actually match the BLS occupation
-
Your employer operates in the same industry represented by the data
-
Your local labor market is represented by the estimate
-
Your experience differs from the broader occupational workforce
-
Your education or specialized skills affect your market position
-
Your compensation includes pay components that should or should not be compared with the OEWS wage figure
The purpose of this process is to turn a salary number into useful context.
Does BLS Salary Data Include Bonuses and Benefits?
This is one of the most important limitations to understand.
OEWS wage estimates represent straight-time gross pay and are exclusive of premium pay. BLS includes certain forms of compensation in its wage definition, including base pay, cost-of-living adjustments, guaranteed pay, hazardous-duty pay, incentive pay such as commissions and production bonuses, and tips.
However, OEWS excludes several other forms of compensation.
These include:
-
Overtime pay
-
Severance pay
-
Shift differentials
-
Nonproduction bonuses
-
Employer costs for supplementary benefits
-
Tuition reimbursements
That means an OEWS wage figure should not automatically be treated as your complete total compensation.
For example, if two jobs have similar BLS wage benchmarks but one position includes significant benefits, equity, or other compensation that is not represented in the OEWS wage figure, looking only at the BLS wage can give an incomplete picture of the employment package.
This is why BLS data works best as one component of salary research.
Why Your Salary May Be Different From the BLS Median
A difference between your pay and the BLS median does not automatically mean something is wrong.
BLS wage estimates describe a broader workforce.
Your individual position may differ because of:
Location
Wages can vary between geographic labor markets. A national benchmark may not accurately describe the market where you work.
Industry
The same occupation can be used across different industries, and industry-specific estimates may provide additional context.
Experience
Experience can influence where an individual falls within the wage distribution. BLS specifically identifies experience as one factor that can affect wage position.
Education
Education can also affect where someone falls within the wage distribution, although the BLS percentiles themselves are not formal education or experience categories.
Job responsibilities
Your actual duties may not perfectly match the standardized occupation you initially selected.
Compensation structure
Your total employment package may contain compensation elements that are not represented in the OEWS wage figure.
The goal is therefore not to ask, "Why don't I earn exactly the BLS median?"
A better question is:
"Given my occupation, location, industry, experience, education, and compensation structure, how should I interpret the BLS wage distribution?"
That produces a much more useful comparison.
What BLS Salary Data Does Not Tell You
BLS is a powerful source for occupational wage research, but it has clear boundaries.
First, it does not tell you the exact salary a specific employer should offer you.
Second, it does not create a personalized "fair salary" based on your résumé.
Third, its percentile figures should not be treated as formal experience levels.
Fourth, the wage data does not represent every form of compensation.
OEWS also has coverage limitations. BLS excludes self-employed workers, owners and partners in unincorporated firms, household workers, and unpaid family workers from the OEWS wage estimates.
This means the data is highly useful for many employees and job seekers, but it should always be interpreted within the scope of the program.
How Current Is BLS Salary Data?
When researching salary information, always check the reference period of the dataset you are using.
For this article, the current approved OEWS dataset is May 2025, released by BLS on May 15, 2026.
The date matters because labor markets change.
A salary estimate from an older OEWS release may still provide useful historical context, but it should not automatically be presented as the latest available BLS benchmark.
BLS OEWS estimates use a methodology that combines six semiannual panels collected over a three-year period and uses model-based estimation.
That methodology is another reason to understand what the data represents rather than treating an individual published number as a real-time salary quote.
How to Use BLS Data in a Salary Negotiation
BLS salary data can be useful during a salary negotiation because it gives you an authoritative market reference.
BLS itself provides guidance on using OEWS data during salary negotiations.
The strongest approach is to use the data as evidence rather than as an ultimatum.
For example, your preparation might look like this:
Occupation: Confirm that the BLS occupation closely matches your actual responsibilities.
Location: Use the most relevant national, state, or metropolitan data available.
Industry: Check whether industry-specific information provides useful additional context.
Wage distribution: Review the median and other percentiles instead of focusing on one number.
Personal context: Consider your experience, education, responsibilities, specialized skills, and other relevant factors.
Market evidence: Compare the BLS benchmark with current job postings or other reliable market information for similar roles.
This creates a stronger salary discussion than saying:
"The BLS says I should make $X."
The BLS data does not actually make that individualized determination.
A more accurate approach is to explain that official occupational wage data places the broader market within a particular distribution and then explain why your qualifications and responsibilities support your compensation expectations.
BLS Salary Data vs. Other Salary Sources
BLS is not the only source people use when researching pay.
Job postings, employer salary ranges, industry research, professional organizations, and other compensation websites can provide additional information.
Each source has limitations.
BLS is particularly useful because it provides standardized occupational wage estimates across geographic and industry dimensions. That makes it valuable for establishing a broad benchmark.
Other sources may provide more current individual job postings or employer-specific information.
Instead of treating these sources as competing answers, use them to cross-check one another.
For example:
| Source | Best use |
|---|---|
| BLS OEWS | Broad occupational wage benchmark |
| State BLS data | State-level occupational comparison |
| Metro BLS data | Local labor-market context |
| Industry-specific BLS data | Industry context for an occupation |
| Current job postings | Evidence about advertised compensation |
| Employer salary ranges | Information about a particular organization's pay range |
| CareerOneStop Salary Finder | Accessible U.S. Department of Labor salary research |
CareerOneStop's Salary Finder is another U.S. Department of Labor resource that can help readers research salary information using OEWS data. It can be useful as a convenient secondary interface, while BLS remains the underlying primary source for the wage estimates.
The goal is not to find the one website with the "correct" salary.
The goal is to build a reasonable picture from reliable evidence.
Common Mistakes When Using BLS Salary Data
Salary research becomes less useful when the data is interpreted too literally.
Using your job title instead of your actual occupation
A job title can be misleading. Always compare your responsibilities with the BLS occupation description.
Looking only at the national median
National data can be useful, but it may not reflect your local labor market.
Treating the 50th percentile as your minimum
The median is a statistical midpoint, not an individualized salary floor.
Treating the 75th percentile as the correct salary request
A higher percentile is not automatically the right negotiation target. Your position within the wage distribution depends on your circumstances.
Assuming percentiles equal experience levels
The 25th, 50th, 75th, and 90th percentiles are points in the wage distribution. They are not official labels for entry-level, mid-career, senior, or expert employees.
Ignoring industry
If industry-specific data is available and relevant, it can add important context to the broader occupation benchmark.
Comparing total compensation with an OEWS wage number
OEWS wage definitions include some forms of incentive compensation but exclude several other compensation categories. Benefits and other excluded compensation should not automatically be assumed to be included in the BLS figure.
Using an outdated BLS dataset without checking the reference period
Always check which OEWS release you are viewing before using a number as a current benchmark.
A Simple BLS Salary Research Checklist
Before using BLS data to make a salary decision, run through this checklist:
-
Occupation: Does the BLS occupation closely match your actual work?
-
Location: Are you using national, state, or metro data appropriate to your situation?
-
Industry: Is industry-specific data available and relevant?
-
Distribution: Have you looked at more than just the median?
-
Experience: Have you considered how your experience compares with the broader workforce?
-
Education: Does your educational background provide relevant context?
-
Compensation: Are you comparing like with like rather than mixing OEWS wages with total compensation?
-
Date: Have you checked the reference period of the BLS data?
-
Market evidence: Have you compared the benchmark with current information from other reliable sources?
-
Decision: Are you using the data as evidence rather than treating it as a guaranteed personal salary?
This checklist helps prevent one of the biggest mistakes in salary research: turning a broad statistical benchmark into an overly precise personal conclusion.
The Best Way to Interpret BLS Salary Data
The most useful way to think about BLS salary data is as a starting point for informed salary research.
You are not looking for a single number that tells you exactly what your job is worth.
You are building context.
Start with the occupation. Then look at the relevant geography. Examine the wage distribution rather than just the median. Consider industry, experience, education, and your actual responsibilities. Finally, compare the BLS benchmark with current market evidence.
That process gives you a much more defensible understanding of where your compensation sits in the broader labor market.
Conclusion
BLS salary data can be one of the strongest starting points for researching what your job may be worth in the U.S. labor market, but its value comes from understanding the data rather than simply copying a salary number.
Use the closest BLS occupation, choose the geographic level that fits your situation, examine the full wage distribution, consider industry and personal factors, and pay attention to what OEWS wages include and exclude.
Most importantly, treat the BLS figure as a benchmark—not a personalized salary guarantee.
When you combine official BLS wage data with your actual responsibilities, location, experience, education, industry, and current market evidence, you can make a much more informed salary decision and enter a compensation discussion with stronger context.
Frequently asked questions
Can I use BLS salary data to negotiate my salary?
Yes. BLS OEWS data can provide an objective market benchmark when preparing for a salary negotiation. It is best used as supporting evidence alongside factors such as your occupation, location, industry, experience, education, and other current market information. It does not determine the exact salary you should receive.
What does the 50th percentile mean in BLS salary data?
The 50th percentile is the median wage in the reported wage distribution. It means half of the reported wages are below that amount and half are above it. It is a market reference point, not an automatic salary floor or a guarantee of what an individual should earn.
Should I use BLS salary data for my city or my state?
Use the most relevant geographic level available for your situation. Metro-area data can provide a more location-specific benchmark when available, while state or national data can provide useful broader context. The best choice depends on where you work and which BLS estimates are available for your occupation.
Does BLS salary data include bonuses and benefits?
BLS OEWS wage data includes certain types of incentive pay, including commissions and production bonuses, as well as tips. It excludes items such as overtime, severance, shift differentials, nonproduction bonuses, employer costs for supplementary benefits, and tuition reimbursements. Therefore, OEWS wages should not be treated as a complete measure of total compensation.
Why is my salary different from the BLS salary for my job?
A BLS wage estimate represents a broader wage distribution rather than an individualized salary. Your pay can differ because of factors such as location, industry, experience, education, occupation classification, and other circumstances. BLS itself notes that experience, education, location, and industry can influence where an individual's wage falls within the distribution.
How often does BLS update salary data?
BLS Occupational Employment and Wage Statistics data are updated annually and use a May reference date. The current approved dataset for this article is the May 2025 OEWS data.
Does BLS salary data show what someone with my experience should earn?
1. Not exactly. BLS provides wage distributions rather than an individualized salary recommendation. Experience and education can influence where someone may fall within the wage distribution, but the percentiles are not formal career-level labels. Use them as market benchmarks together with your specific occupation, location, industry, and background.

James Collins writes practical content about work, business, careers, workplace trends, productivity, and professional development. His articles focus on helping readers understand everyday workplace decisions, business...