What Is Google Finance? How to Track Stocks and Market Data
Learn what Google Finance is and how to use it to search for stocks, create watchlists, compare securities, track portfolios, and understand market data. This beginner-friendly guide also explains quote timing, platform limitations, and how Google Finance compares with Yahoo Finance.
In this article
- What Is Google Finance and How Does It Work?
- Key Features of Google Finance
- Stock Prices and Market Data
- Stock Charts
- Watchlists
- Stock Comparisons
- Financial News
- AI-Powered Research and Portfolio Features
- How to Use Google Finance to Track Stocks
- Step 1: Open Google Finance
- Step 2: Search for a Company or Ticker Symbol
- Step 3: Open the Security Page
- Step 4: Follow the Security
- Step 5: Review Its Performance
- How to Create a Google Finance Watchlist
- Create a Custom Watchlist
- Example of a Beginner's Watchlist
- Organize Your Watchlists
- Remove or Unfollow a Security
- How to Read Stock Prices and Market Data
- Stock Price
- Daily Price Change
- Market Capitalization
- Historical Performance
- Market Indexes
- How to Compare Stocks Using Google Finance
- Basic Comparison Steps
- Example: Comparing Two Technology Stocks
- Compare Markets
- How to Use Google Finance Charts
- Line Charts
- Candlestick Charts
- Technical Indicators
- Choose the Right Time Range
- Google Finance vs. Yahoo Finance
- Is Google Finance Useful for Beginners?
- Important Limitations of Google Finance
- Financial Data May Be Delayed
- It Is Not a Brokerage
- Information May Be Incomplete or Incorrect
- AI Insights Can Make Mistakes
- It Does Not Replace Financial Advice
- A Practical Way to Use Google Finance for Market Research
- 1. Define What You Want to Monitor
- 2. Create a Focused Watchlist
- 3. Review Price Movement in Context
- 4. Read Related News
- 5. Verify Important Information
- 6. Avoid Treating Daily Changes as Decisions
- Conclusion
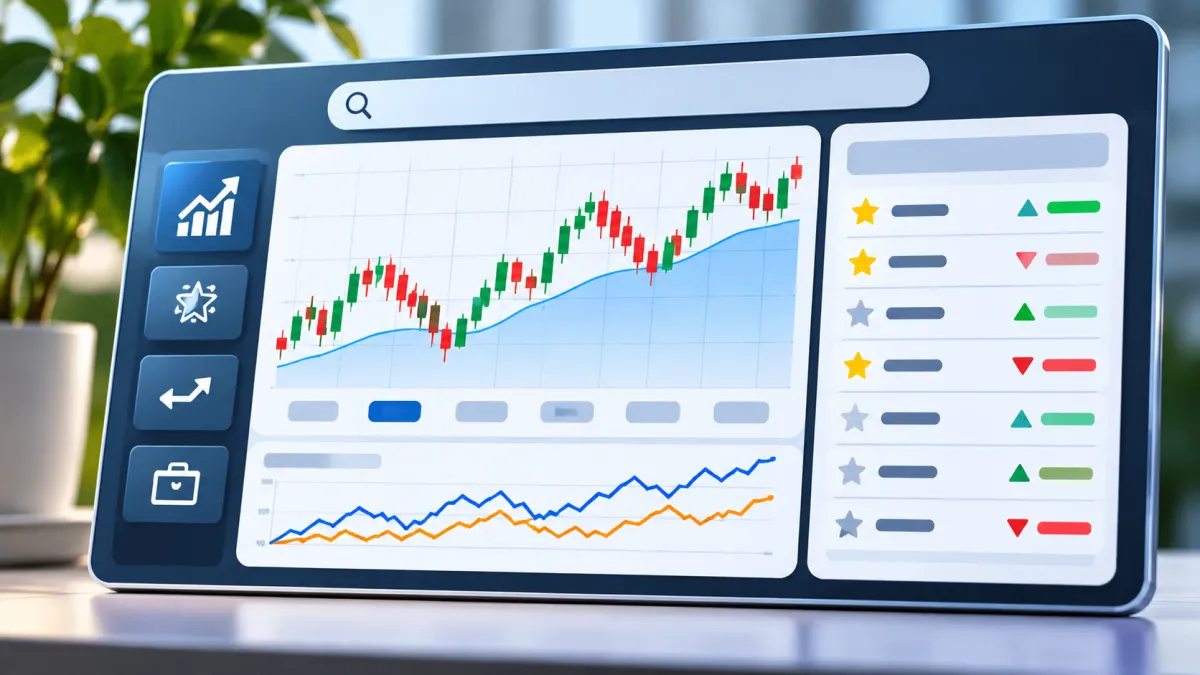
Google Finance is a free online financial information platform that helps people follow stocks, market indexes, currencies, and other financial securities. It provides stock prices, charts, financial news, watchlists, and tools for comparing investments. Its newer experience also includes AI-powered research features and portfolio tracking capabilities.
For beginners in the United States, Google Finance can be a convenient way to understand what is happening in the stock market without immediately signing up for a brokerage account or paying for a premium financial research service.
You can use it to follow companies such as Apple, Microsoft, Amazon, or other publicly traded businesses, compare their stock performance, and organize securities you want to monitor. However, Google Finance is primarily an information and research tool. It is not a substitute for a brokerage account, professional financial advice, or independent research.
This guide explains how Google Finance works, how to use its features, how to create watchlists, how to read stock charts, and what limitations to understand before relying on it for financial decisions.
What Is Google Finance and How Does It Work?
Google Finance is a financial information service available through Google. Its website, Google Finance, displays information about financial securities and markets.
When you search for a company or a ticker symbol, Google Finance provides a page with relevant financial data. Depending on the security and data provider, that information may include:
-
Current or most recently reported stock price
-
Daily price change
-
Historical price charts
-
Market capitalization
-
Financial news
-
Related securities
-
Comparison charts
-
Watchlist options
-
Additional research information
For example, searching for Apple or its ticker symbol, AAPL, lets you view its stock information and follow its performance. You can also compare Apple with another company, such as Microsoft, to examine how their stock prices have moved over a selected period.
Google Finance collects financial information from exchanges and other data providers. The displayed data may be delayed, and the timing can vary by exchange and security. Therefore, the price you see should not automatically be treated as the exact price available for a trade.
Google Finance is useful for market monitoring and learning. It does not guarantee the accuracy or completeness of all information displayed.
Key Features of Google Finance
Google Finance offers several tools that can help beginners and experienced market watchers organize financial information.
Stock Prices and Market Data
The platform displays price information for stocks and other securities. A stock page may show the latest available price, the daily change, a chart, and additional financial information.
This helps users understand whether a stock has moved up or down during a particular period. You can also view historical performance rather than focusing only on the latest price.
For example, if you are following a company listed on the Nasdaq or New York Stock Exchange, you can search its ticker symbol and view its available market data.
Keep in mind that a stock price alone does not tell you whether a company is financially strong or whether its shares are a suitable investment.
Stock Charts
Google Finance provides charts that help users examine price movements over time. Charts can make it easier to identify broad trends, compare periods, and understand how a stock has behaved.
Depending on the interface and available features, charts may offer different time ranges and visualization options. The newer Google Finance experience also includes advanced charting capabilities, such as candlestick charts and technical indicators.
Charts are useful for understanding historical movement, but past performance does not predict future results.
Watchlists
A watchlist allows you to keep a collection of stocks or other securities in one place. Rather than searching for each company repeatedly, you can follow selected securities and monitor their information from your watchlist.
Google Finance includes a default watchlist and supports custom watchlists. You can organize securities according to your own interests, such as technology companies, dividend stocks, or companies you are researching.
Stock Comparisons
Google Finance allows users to compare securities. This can help you examine the performance of two or more companies over a similar period.
For example, you might compare Apple and Microsoft to see how their stock prices have changed. A comparison chart can help you visualize relative movement, although it does not by itself explain the reasons behind that movement.
Financial News
Google Finance displays financial news related to securities and markets. News can provide context for price movements, company announcements, and broader market developments.
Reading news alongside price charts may help you understand why a security is receiving attention. However, headlines can be incomplete or misleading when viewed without the full article or broader context.
AI-Powered Research and Portfolio Features
Google introduced a newer AI-powered Finance experience with additional research and visualization tools. The experience includes AI-assisted financial research, advanced charts, market news, and other capabilities.
Google also announced portfolio tracking features and a dedicated Android app in 2026. Feature availability may vary by region, device, and rollout status. Check the official Google Finance interface and Help Center for the current options available to your account.
AI-generated insights can be useful starting points, but they may contain mistakes. Important financial information should be verified against reliable sources.
How to Use Google Finance to Track Stocks
You can begin using Google Finance through a web browser. The basic process is straightforward.
Step 1: Open Google Finance
Visit google.com/finance.
The homepage provides access to market information, search, and securities you may want to follow.
Step 2: Search for a Company or Ticker Symbol
Use the search bar to find a company, market index, or security.
For example, you can search for:
-
Apple or AAPL
-
Microsoft or MSFT
-
Amazon or AMZN
-
Alphabet or GOOGL
A ticker symbol is a short identifier used to represent a security on a stock exchange. Searching by ticker can help you locate the correct security, especially when multiple companies have similar names.
Step 3: Open the Security Page
Select the correct result. Its page may display price information, a chart, financial news, and other data.
Review the security name and ticker symbol before adding it to your watchlist. This is particularly important when searching for unfamiliar companies.
Step 4: Follow the Security
On the security page, select the Follow option.
The security can be added to your default watchlist. If you use custom watchlists, you can select the list where you want it to appear.
Step 5: Review Its Performance
Once you follow a security, you can return to your watchlist to monitor it.
Look at more than the daily price change. Consider reviewing its historical chart, related news, and available financial information.
Following a stock does not mean you should buy it. A watchlist is simply a way to organize securities you are interested in researching.
How to Create a Google Finance Watchlist
A custom watchlist can make your market research more organized. Instead of maintaining one large list, you can separate companies according to your interests.
Create a Custom Watchlist
-
Open Google Finance.
-
Find the Your Watchlists section.
-
Select New watchlist.
-
Enter a name for the watchlist.
-
Select Add investments.
-
Search for the securities you want to include.
-
Add the selected securities to your list.
The exact labels and layout may differ between desktop and mobile interfaces.
Example of a Beginner's Watchlist
A hypothetical US stock watchlist might look like this:
| Company | Ticker | Reason to Monitor |
|---|---|---|
| Apple | AAPL | Consumer technology |
| Microsoft | MSFT | Software and cloud computing |
| Amazon | AMZN | E-commerce and cloud services |
| Alphabet | GOOGL | Search and digital advertising |
| Nvidia | NVDA | Semiconductor industry |
This example is for learning and organizing research. It is not a recommendation to purchase these securities.
You could create separate lists for industries, companies you are researching, or securities you already own. The goal is to make your research easier to manage.
Organize Your Watchlists
A practical approach is to keep watchlists focused.
For example:
-
Technology Companies: Stocks from the technology sector
-
Companies to Research: Securities you have not evaluated yet
-
Portfolio Monitoring: Securities you currently hold
-
Market Indexes: Major indexes you want to follow
Avoid adding every stock you encounter. A smaller, organized list can make it easier to review relevant information.
Remove or Unfollow a Security
If you no longer want to monitor a stock, open its page and select the Following option. You can then remove it from the relevant watchlist.
Google Finance also provides options to rename or delete custom watchlists. Its default watchlist has different management limitations from custom lists.
How to Read Stock Prices and Market Data
Google Finance displays several kinds of financial information. Understanding the basic terms can help you interpret a stock page more accurately.
Stock Price
The stock price is the price at which a share is quoted or traded in the market.
For example, if a company’s stock is displayed at $100 per share, that does not mean the company is worth only $100. It means one share is currently quoted at that price according to the available data.
A share price by itself is not enough to determine whether a stock is expensive or inexpensive.
Daily Price Change
Google Finance may show the amount and percentage by which a stock has changed during the trading session.
A positive change generally indicates that the displayed price is higher than the comparison price. A negative change indicates that it is lower.
For example, if a stock moves from $100 to $105, the increase is $5, or 5%.
This is a simple hypothetical calculation:
[
\frac{105-100}{100}\times100=5%
]
Daily changes can be useful for monitoring activity, but they can also fluctuate significantly.
Market Capitalization
Market capitalization, often called market cap, represents the total market value of a company's outstanding shares.
The basic calculation is:
Market capitalization = Share price × Outstanding shares
For example, if a company has 10 million outstanding shares and each share is priced at $20, its market capitalization would be $200 million.
Market cap can help you compare the relative size of companies. It does not represent the company's cash balance, revenue, or total assets.
Historical Performance
Historical charts display how a security's price has moved over a selected period.
You might examine a stock's movement over a day, a month, a year, or a longer period, depending on the available chart controls.
Historical performance can provide context. For instance, a stock that has risen over a year may still have experienced significant declines during that period.
Market Indexes
A market index tracks a group of securities and provides a way to observe broader market performance.
Examples of US market indexes include:
-
S&P 500
-
Dow Jones Industrial Average
-
Nasdaq Composite
These indexes represent different groups of securities and are not interchangeable. Monitoring an index can provide broader market context, but it does not show how every individual stock is performing.
How to Compare Stocks Using Google Finance
Comparing stocks can help you understand how different securities have performed relative to one another.
Basic Comparison Steps
-
Open Google Finance.
-
Search for the first security.
-
Open its page.
-
Look beneath its chart for comparison options.
-
Select a suggested security or choose Compare to search for another.
-
Review the comparison chart.
You can remove a security from the comparison if you no longer need it.
Example: Comparing Two Technology Stocks
Suppose you want to compare Apple and Microsoft.
You could examine:
-
Their stock price movements over the same period
-
The direction of their historical performance
-
Relevant company news
-
Available financial information
-
Differences in their business models
A chart may show that one stock rose more than another over a specific period. That observation does not necessarily mean the first company is a better investment.
For a more meaningful comparison, use the same time range and consider factors beyond price, such as profitability, valuation, business risks, and future prospects.
Compare Markets
Google Finance also includes market comparison functionality. Depending on the interface, you may be able to compare broader markets or categories such as currencies and regional markets.
This can help you understand how market groups have moved relative to each other.
Comparisons should be interpreted carefully because different markets may have different trading hours, currencies, and data timing.
How to Use Google Finance Charts
Charts are one of the most useful features for visualizing stock price movement. They can also be confusing if you are new to financial markets.
Line Charts
A line chart connects price points over time. It provides a simplified view of how a stock has moved.
Line charts are useful for:
-
Reviewing general price direction
-
Comparing historical periods
-
Observing major rises and declines
-
Viewing a stock's performance without focusing on individual trades
A line chart does not show every detail of trading activity.
Candlestick Charts
Candlestick charts provide more information about price movement during a selected interval.
A candlestick typically represents four prices:
-
Open: The price at the beginning of the interval
-
High: The highest price during the interval
-
Low: The lowest price during the interval
-
Close: The price at the end of the interval
Candlesticks are often displayed in different colors to indicate whether the closing price was higher or lower than the opening price. The colors can vary depending on the chart settings.
These charts can help users understand price ranges and movement, but interpreting them for trading decisions requires additional knowledge.
Technical Indicators
Technical indicators are calculations based on market data, often including price and volume.
The newer Google Finance charting experience has introduced more advanced chart tools and indicators. Availability may depend on the current interface.
Indicators can help users explore patterns, but they should not be treated as guaranteed signals. Different analysts may interpret the same chart differently.
Choose the Right Time Range
A chart's time range changes the context of what you see.
A short period may highlight daily fluctuations. A longer period may reveal broader trends or periods of volatility.
When comparing securities, try to use the same time range. Otherwise, the comparison may be misleading.
Google Finance vs. Yahoo Finance
Google Finance and Yahoo Finance are both commonly used financial information platforms. They provide overlapping services, but their interfaces and available tools differ.
| Feature | Google Finance | Yahoo Finance |
|---|---|---|
| Stock prices | Available | Available |
| Historical charts | Available | Available |
| Watchlists | Available | Available |
| Financial news | Available | Available |
| Stock comparisons | Available | Available |
| Portfolio-related tools | Available, with newer features | Available, with platform-specific features |
| Advanced research options | AI-powered features in newer experience | Additional tools and features, some subject to product tier |
| User experience | Integrated with Google’s ecosystem | Dedicated finance-focused platform |
Neither platform is universally better for every user.
Google Finance may appeal to someone who wants a simple interface and is already familiar with Google services. Yahoo Finance may appeal to users who prefer its finance-focused layout and available research tools.
The best choice depends on which information you need, how you organize your research, and whether the available tools meet your requirements.
You can also use both platforms to cross-check financial information. When comparing data, make sure the figures refer to the same security, time period, and data source where possible.
Is Google Finance Useful for Beginners?
Google Finance can be useful for people who are learning about the stock market because it provides a way to observe securities without immediately making a financial commitment.
A beginner can use the platform to:
-
Learn ticker symbols
-
Follow publicly traded companies
-
Observe daily market movements
-
Review historical charts
-
Compare companies
-
Read financial news
-
Build a watchlist for research
-
Become familiar with financial terminology
For example, a person who is interested in the technology sector could create a watchlist of several companies and monitor their performance over a few weeks. This can help them understand that stock prices move for many reasons, including company announcements, earnings, economic developments, and changes in investor expectations.
However, monitoring stocks is not the same as learning how to invest. Beginners should also understand diversification, risk tolerance, investment goals, fees, and the possibility of losing money.
Google Finance can support the learning process, but it should not be the only resource used to make investment decisions.
Important Limitations of Google Finance
Google Finance is convenient, but it has limitations that users should understand.
Financial Data May Be Delayed
The timing of price data depends on the exchange and data provider. Some information may be real-time, while other information may be delayed.
If you are preparing to place a trade, verify the price and trading details through your brokerage platform or another appropriate source.
It Is Not a Brokerage
Google Finance provides financial information and research tools. It is not a brokerage service through which you directly execute stock trades.
If you decide to buy or sell securities, you generally need to use a brokerage account or another authorized trading service.
Information May Be Incomplete or Incorrect
Financial data comes from exchanges and third-party providers. Errors, omissions, delays, or interruptions can occur.
Google's financial disclaimer also explains that information is provided for informational purposes and should not be used as the sole basis for investment decisions.
AI Insights Can Make Mistakes
AI-powered research tools can help summarize information or explore financial questions. However, AI responses may contain inaccuracies or omit important context.
Verify important claims using company filings, official investor relations materials, financial statements, and other reliable sources.
It Does Not Replace Financial Advice
Google Finance is not a personal financial adviser. Its information does not account for your individual financial situation, investment objectives, or risk tolerance.
If you need personalized guidance, consider consulting a qualified financial professional.
A Practical Way to Use Google Finance for Market Research
A simple routine can help you use Google Finance more effectively without getting distracted by every price movement.
1. Define What You Want to Monitor
Choose a specific purpose. You might be following a company, learning about a sector, or monitoring a group of securities.
Avoid building a watchlist without a clear reason for including each security.
2. Create a Focused Watchlist
Add the securities that match your research goal. Keep the list organized and remove items that are no longer relevant.
3. Review Price Movement in Context
Look at more than the latest quote. Review historical charts and consider the period over which the movement occurred.
4. Read Related News
News may provide context for market changes. Read the full article when an important event is mentioned rather than relying only on a headline.
5. Verify Important Information
If you are evaluating a company, check its official filings and investor relations resources. For US public companies, filings are available through the SEC's EDGAR database.
Google Finance can help you locate and monitor information, while official documents can provide more detailed company disclosures.
6. Avoid Treating Daily Changes as Decisions
A stock rising or falling on a particular day does not automatically mean you should buy or sell it.
Use market data as one part of a broader research process. Decisions should be based on your goals, risk tolerance, and a careful evaluation of the investment.
Conclusion
Google Finance is a convenient financial information platform for tracking stocks, following market indexes, creating watchlists, comparing securities, and reviewing financial news. Its charts and newer AI-powered research and portfolio features can also help users explore market information in more detail.
For beginners in the United States, it can be a practical starting point for learning how stock prices and markets behave. Creating a focused watchlist and reviewing historical performance can help make financial research more organized.
However, Google Finance is an information tool, not a brokerage or a personal investment adviser. Financial data may be delayed, information can contain errors, and AI-generated insights should be verified.
Use Google Finance to monitor and learn about the market, and rely on additional research and appropriate professional guidance when making important financial decisions.
Frequently asked questions
1. Can you buy stocks directly through Google Finance?
No. Google Finance is a financial information and research platform, not a brokerage. You can use it to monitor securities and research market information, but stock purchases must be made through a brokerage account.
2. Do you need a Google Account to use Google Finance?
You can access some financial information without signing in. A Google Account is required for features such as custom watchlists and certain advanced research capabilities.
3. Is Google Finance available as a mobile app?
Google has announced a dedicated Android app for Google Finance. Its current help documentation describes iOS availability as coming soon. App availability and features can change, so readers should check Google's latest official documentation.
4. Can Google Finance track stocks from different markets?
Google Finance supports securities from different markets. However, coverage, available features, and quote timing can vary by exchange and data provider.
5. Can Google Finance be used as the only source for investment decisions?
No. Google Finance can help users monitor market information and research securities, but it should not be the only source used for investment decisions. Verify important information with reliable sources and understand that AI-generated insights may contain errors.

Daniel Brooks writes practical content about personal finance, budgeting, saving, credit, banking, taxes, and everyday money decisions. His work focuses on explaining financial topics in straightforward language and help...